Worklog Chart Report Gadget Cloud
- Eisonesoft Atlassian Developers

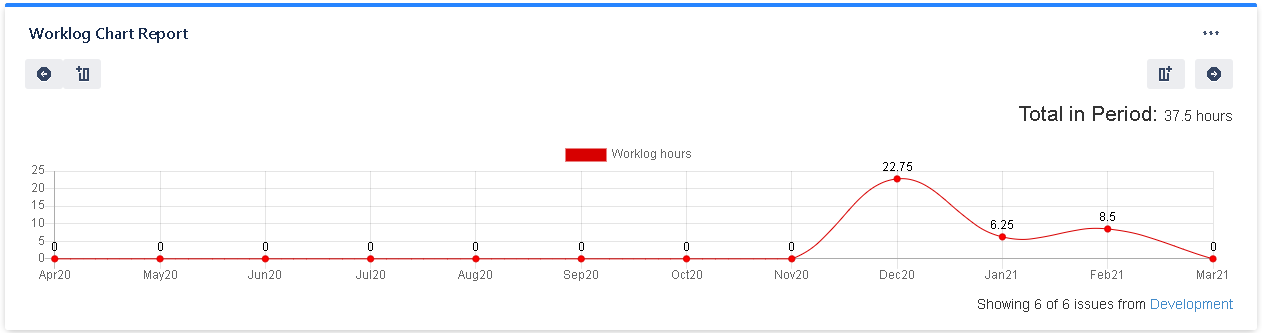
The Worklog Chart Report displays a Bar/Line Chart with the worklogs of a selected filter. You can select to display the information daily, weekly, monthly, quarterly or Yearly.
Features
- Shows a bar/line chart with the filter worklogs by periods.
- Can configure show the data daily, weekly, monthly, quarterly or yearly.
- Can configure filter only the worklogs made by one ore more user/group.
- Can configure the color of the chart.
Gadget Configuration
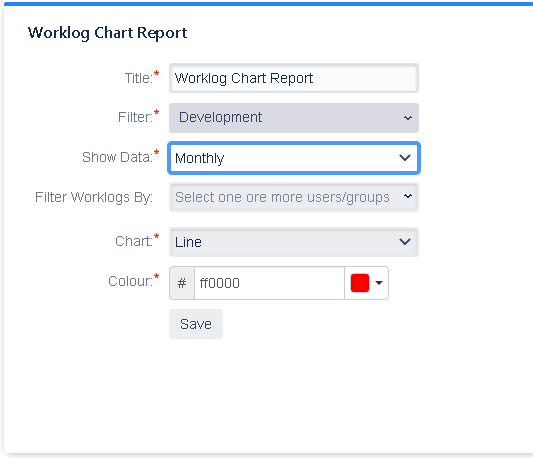
Title: Set the title of the gadget
Filter: Select the filter to show.
Show Data: Select how to show the data (daily, weekly, monthly, quarterly or yearly)
Filter Worklogs By: Select one or more user/group for filter the worklogs made by. If not user/group is selected it shows worklogs for all users
Chart: Select the type of the chart.
Colour: Select the color of the chart.
Gadget View
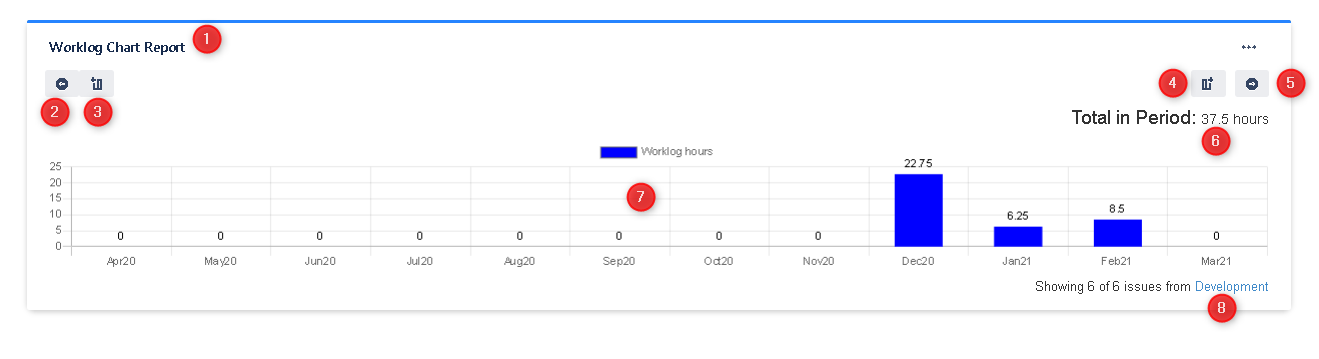
1: This is the title of the gadget
2: Move to the previous period
3: Add the previous period to the current view
4: Add the next period to the current view
5: Move to the next period
6: The total hours in the showed period
7: The chart with the worklogs information
8: This is the information of the number of issues showed in the chart and the selected filter. If not all issues in filter are showed you can fetch more