Gantt Report Gadget Cloud
- Eisonesoft Atlassian Developers

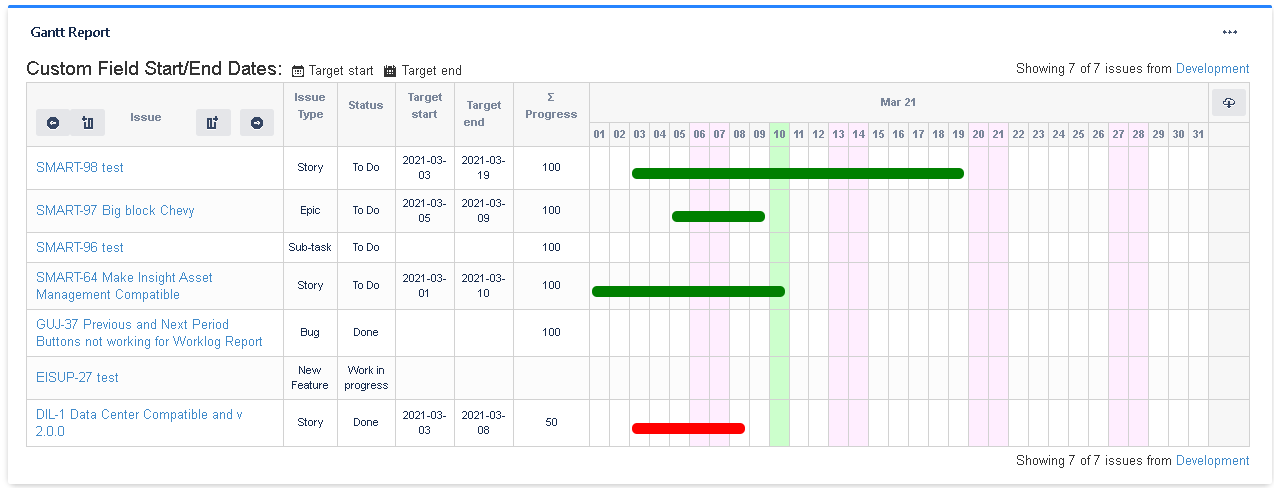
The Gantt Report displays the schedule of issues returned by a selected filter. Extensive configuration options available including filter, additional fields and non working days.
Features
- Displays the schedule of issues returned by a selected filter.
- Can configure show the data daily, weekly, monthly, quarterly or yearly.
- Can configure the Customfield Start Date.
- Can configure the Customfield End Date.
- Can configure the users/groups that will be able to edit the schedule from the Gantt Report.
- With double click you can set the start and end date of one issue.
- With drag and drop you can change the start date or the end date of an issue.
- Can configure additional field for display and order them with drag and drop
- Can configure non working days.
- Can be exported to Excel to get raw scheduled of the issues for other processing.
Gadget Configuration
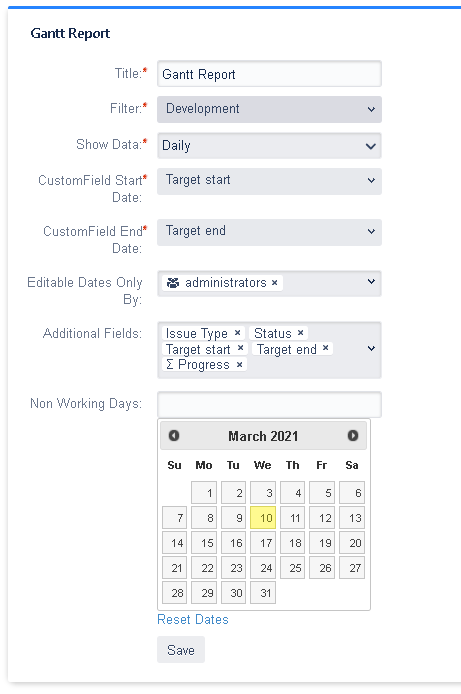
Title: Set the title of the gadget
Filter: Select the filter to show.
Show Data: Select how to show the data (daily, weekly, monthly, quarterly or yearly)
CustomField Start Date: Select the field that will be used to determine the start of the issue.
CustomField End Date: Select the field that will be used to determine the end of the issue.
Editable Dates Only By: Select the users/groups that will be able to edit the schedule from the Gantt Report.
Additional Fields: Select one or more additional fields to display in the gadget view. While configuring additional fields you can order it with drag and drop.
Non Working Days: Select the non working days to display in the gadget view. This setting only affects when the gadget is configured showing data daily.
Gadget View
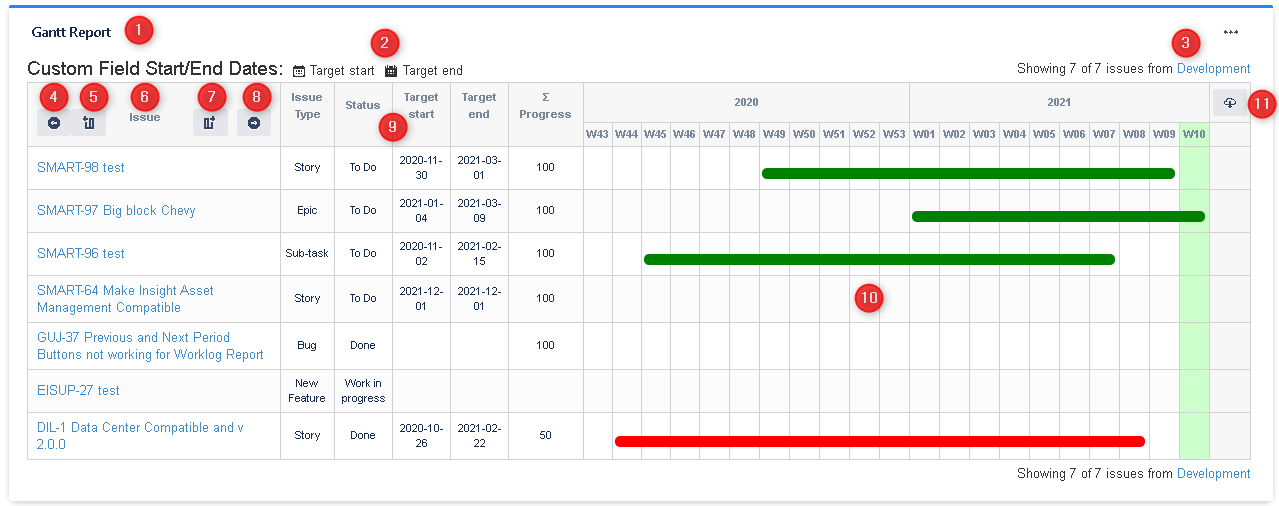
1: This is the title of the gadget
2: This is the current Customfields Start/End Dates.
3: This is the information of the number of issues showed in the report and the selected filter. If not all issues in filter are showed you can fetch more
4: Move to the previous period
5: Add the previous period to the current view
6: This is the information of the current Issue
7: Add the next period to the current view
8: Move to the next period
9: The additional fields displayed. Click on one additional field header for order the table
10: The report table with the schedule information
11: This is the export button for download an Excel file