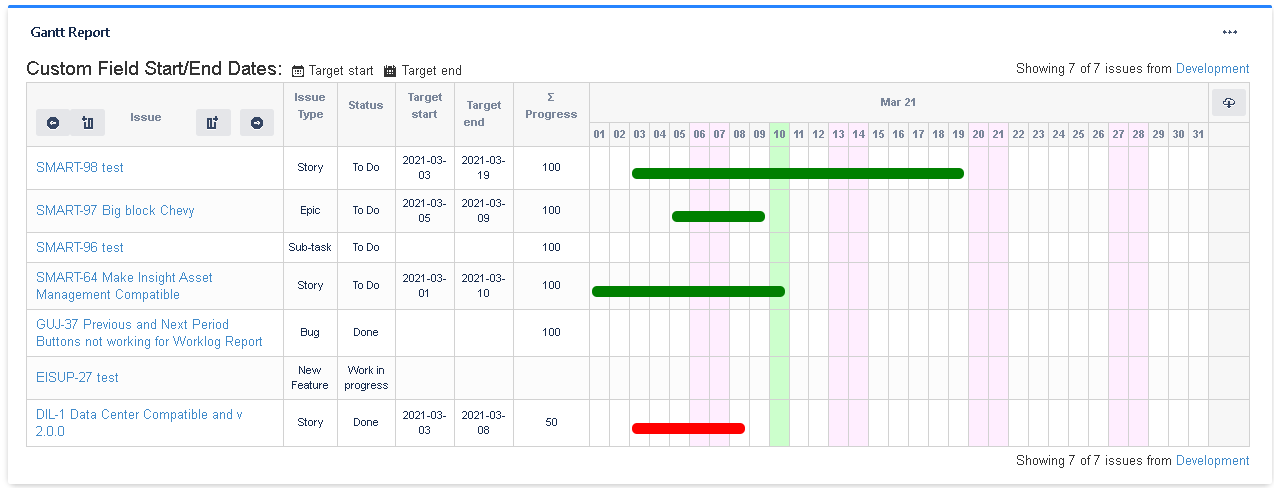
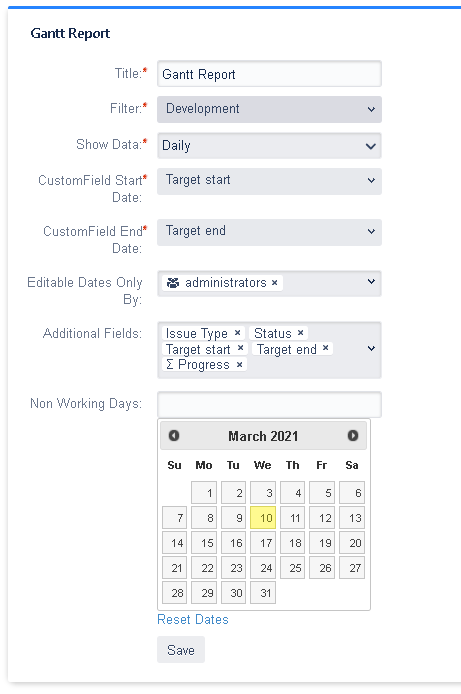
The Gantt Report displays the plan of issues returned by a selected filter. Extensive configuration options available including filter, additional fields and non working days.
Gadget Configuration
Saved Filter: Select the filter to show.
Period: Select the period to show (Custom, Current Month, Current Week).
Period Start: Only available for the Custom Period.
Period End: Only available for the Custom Period
CustomField Start Date: Shows a List of Date Customfields.
CustomField End Date: Shows a List of Date Customfields
- By default, CustomField Start Date and CustomField End Date only shows the Jira Standard Date Fields and the listed Customfields in Customfield Compatibility section
- Do you have any Date Customfield Type to add? Open us a ticket: https://eissoftware.atlassian.net/servicedesk/customer/portal/1/group/1/create/6
Date Editable Only By: Type the usernames separated by , to allow the users who can be able to edit issues Start and End Dates
Show Subtasks: To show subtasks
Gadget View
%: Indicates the progress of time spent of the issue
Green bar: Indicates that the progress is 100%
Orange bar: Indicates that the progress isn't 100% but the end date is in the future
Red bar: Indicates that the progress isn't 100% and the end date is in the past
Customfield Compatibility
Jira Misc Custom Fields app:
- Calculated (scripted) Date/Time Field
- Last Field Value Change Date/Time Field
- Status entered On date/time Field
- Transition Date/Time Field
Jira Workflow Toolbox app:
- Calculated Date-Time Field
Excel Export
By clicking to the export icon it generates an Excel file

