View your tasks in gantt format and edit your start and end dates easily
toc
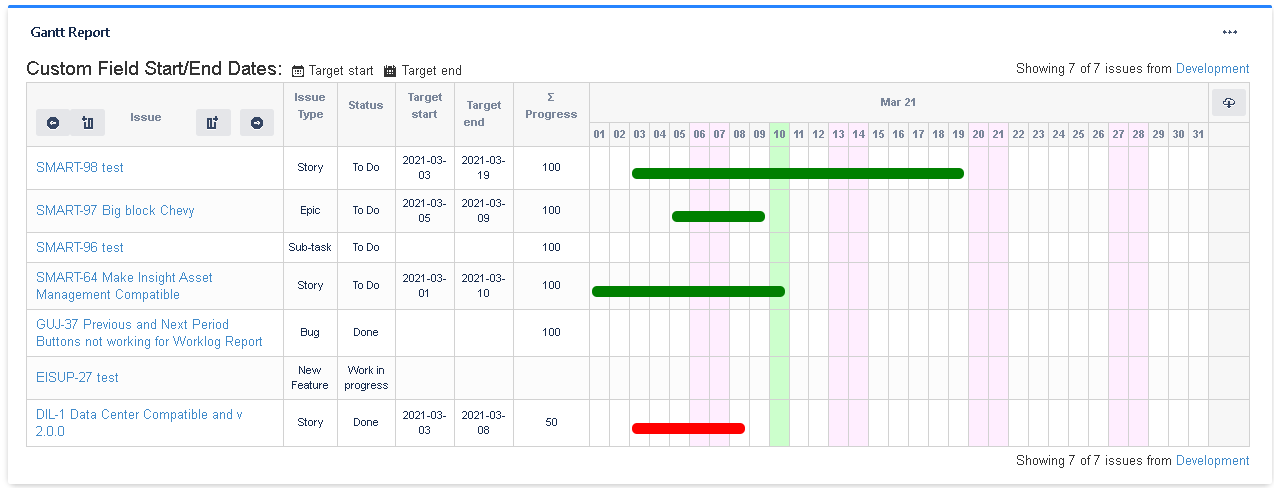
The Gantt Report displays the schedule of issues returned by a selected filter. Extensive configuration options available including filter, additional fields and non working days.
Features
- Displays the schedule of issues returned by a selected filter.
- Can configure show the data daily, weekly, monthly, quarterly or yearly.
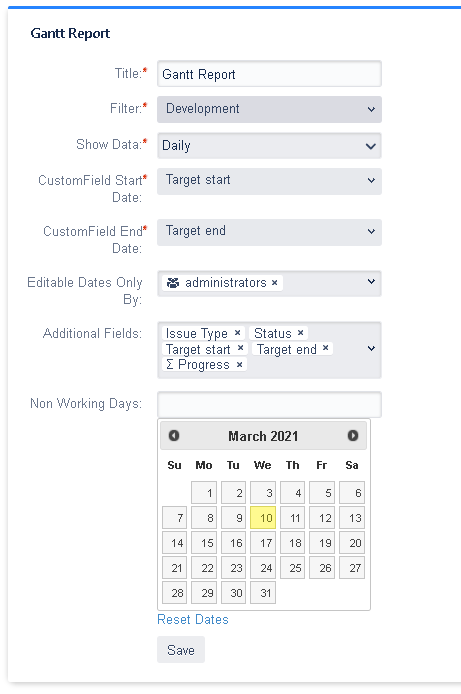
- Can configure the Customfield Start Date.
- Can configure the Customfield End Date.
- Can configure the users/groups that will be able to edit the schedule from the Gantt Report.
- With double click you can set the start and end date of one issue.
- With drag and drop you can change the start date or the end date of an issue.
- Can configure additional field for display and order them with drag and drop
- Can configure non working days.
- Can be exported to Excel to get raw scheduled of the issues for other processing.
Gadget Configuration
| Section | ||||||||||||
|---|---|---|---|---|---|---|---|---|---|---|---|---|
|
Gadget View
Excel Export
By clicking to the export icon it generates an Excel file
...
| Section |
|---|
| Column | ||
|---|---|---|
| ||
| Column | ||
|---|---|---|
| ||
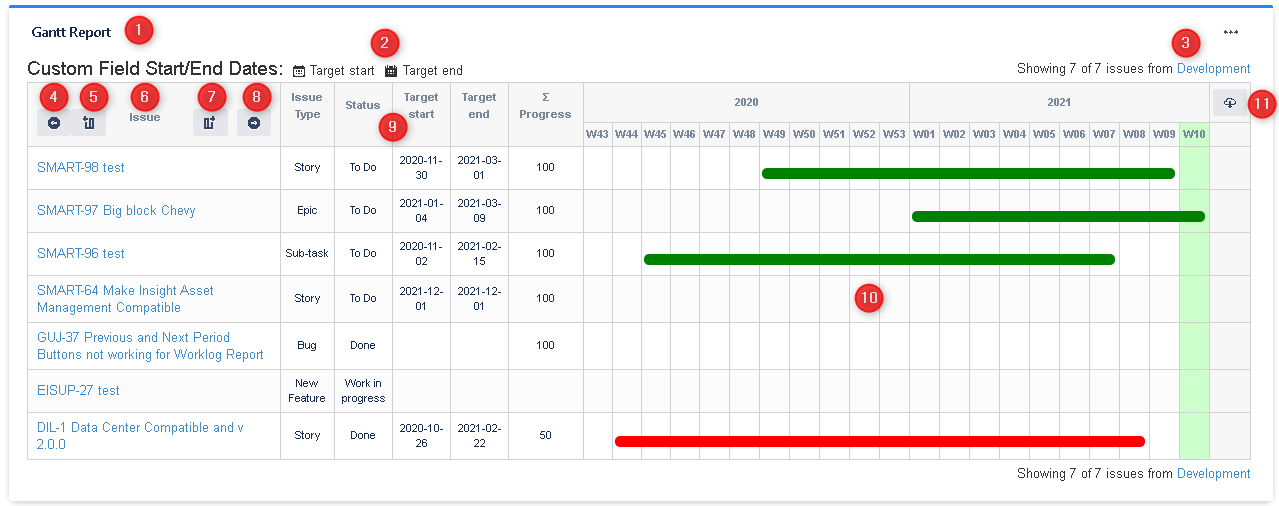
%: Indicates the progress of time spent of the issue Green bar: Indicates that the progress is 100% Orange bar: Indicates that the progress isn't 100% but the end date is in the future Red bar: Indicates that the progress isn't 100% and the end date is in the past |
Customfield Compatibility
...
Jira Misc Custom Fields app:
- Calculated (scripted) Date/Time Field
- Last Field Value Change Date/Time Field
- Status entered On date/time Field
- Transition Date/Time Field
Jira Workflow Toolbox app:
- Calculated Date-Time Field
1: This is the title of the gadget 2: This is the current Customfields Start/End Dates. 3: This is the information of the number of issues showed in the report and the selected filter. If not all issues in filter are showed you can fetch more 4: Move to the previous period 5: Add the previous period to the current view 6: This is the information of the current Issue 7: Add the next period to the current view 8: Move to the next period 9: The additional fields displayed. Click on one additional field header for order the table 10: The report table with the schedule information 11: This is the export button for download an Excel file |


