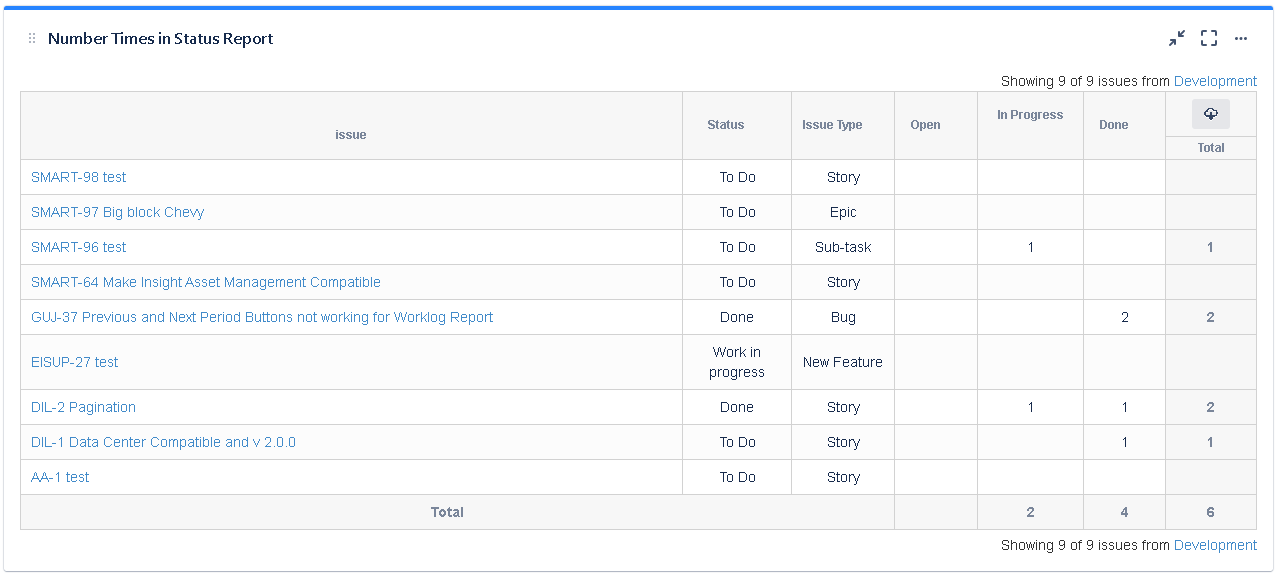
The Number Times in Status Report shows the number of times each issue was in each status.
Features
- Shows a bar/line chart with the filter worklogs by periods.the number of times each issue was in each status
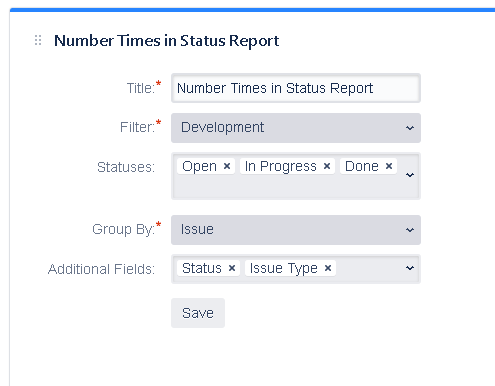
- Can configure show the data daily, weekly, monthly, quarterly or yearlythe statuses to count.
- Can configure filter only the worklogs made by one ore more user/group.Can configure the color of the chart.group by different issue fields.
- Can configure additional field for display and order them with drag and drop
- Can be exported to Excel to get raw data for other processing
Gadget Configuration
| Section | ||||||||||
|---|---|---|---|---|---|---|---|---|---|---|
|
Gadget View
| Section |
|---|
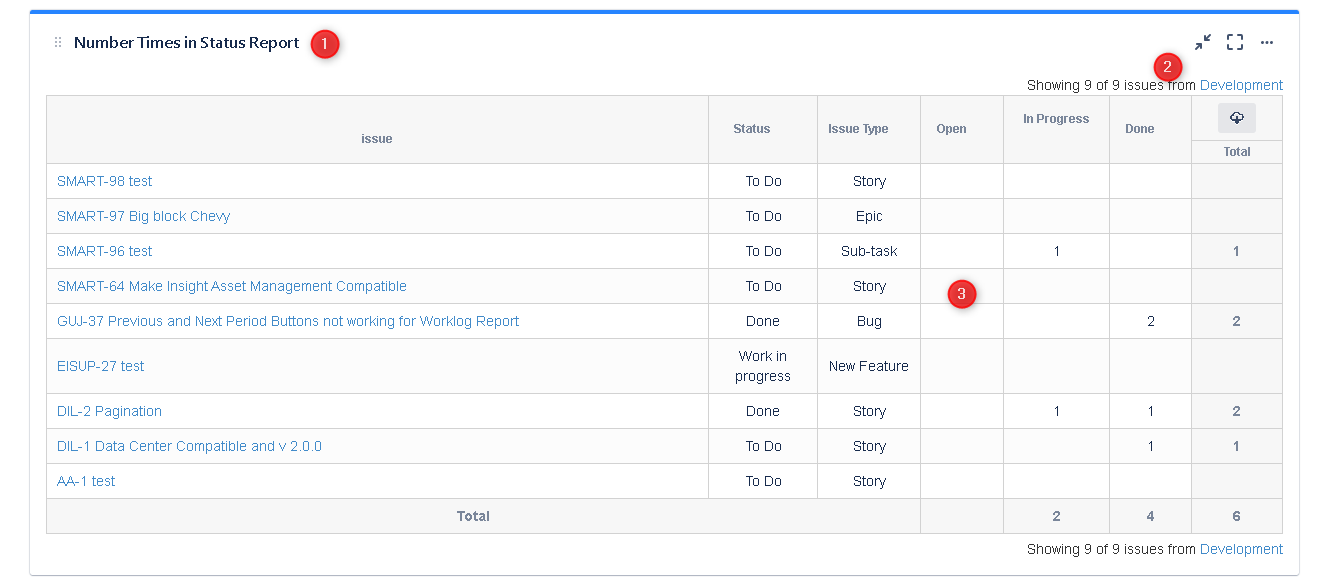
1: This is the title of the gadget 2: Move to the previous period38: : Add the previous period to the current view 4: Add the next period to the current view 5: Move to the next period 6: The total hours in the showed period 7: The chart with the worklogs information This is the information of the number of issues showed in the chart and the selected filter. If not all issues in filter are showed you can fetch more 3: The information of the number of times each issue was in each status |


