 Image Modified
The Number Field Sum-up Report displays a Bar/Pie Chart with the sum of the values of the selected number field on a selected filter. Extensive configuration options available including the Target and the Color of the chart.
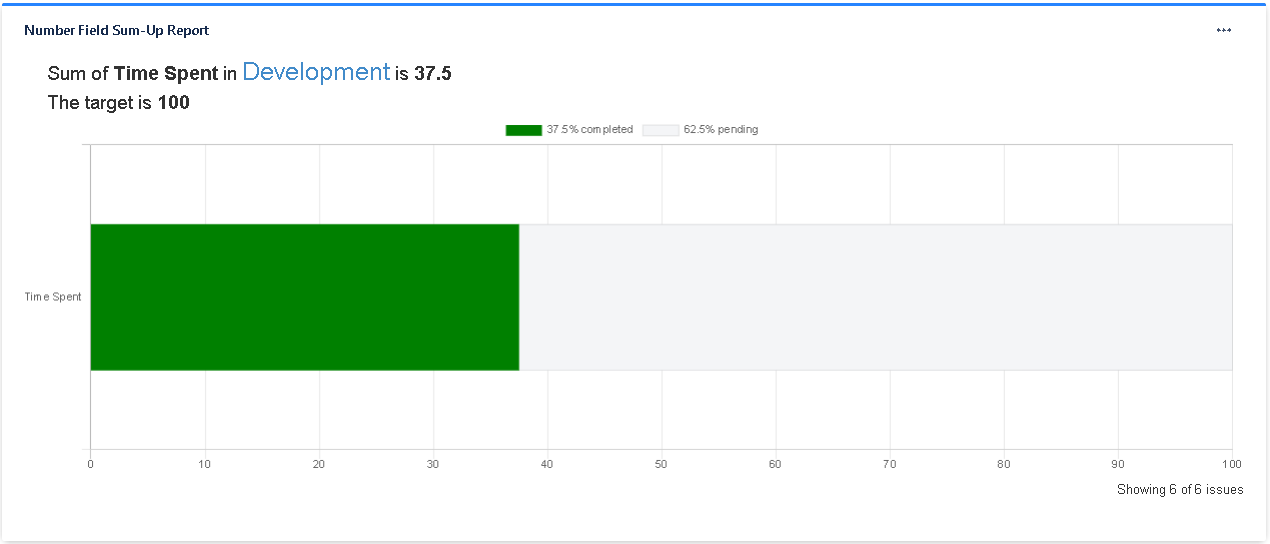 Image Modified
Features
- Displays summary of worked hours of filter issuesShows the sum of the selected field in a filter.
- Can be select only the user selected worked hours.Can be exported to Excel to get raw worked hours for other processingconfigure the target.
- Can configure the chart type.
Gadget Configuration
| Section |
|---|
| Column |
|---|
|  Image Removed Image Removed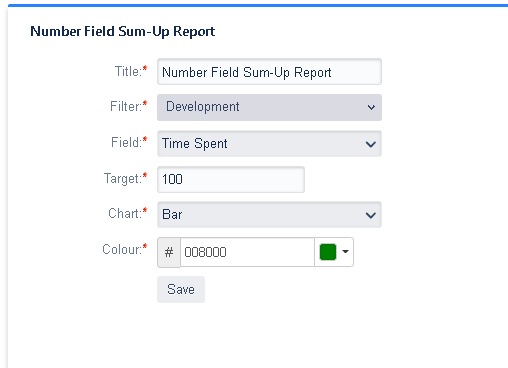 Image Added Image Added
|
| Column |
|---|
| | Saved Title: Set the title of the gadget Filter: Select the filter to show. PeriodField: Select the periodNum Weeks: Type the number of weeks to show User filter: Select the user to show worklogs. If not user selected it shows worklogs for all users Show Subtasks: To show subtasks Group By: Group the worklogs by a issue field. The options are Project, Issuetype, Reporter, Assignee, Priority and the Select Customfieldsfield to sum target: Select target with a valid number Chart: Select the type of the chart. Colour: Select the color of the chart. |
|
Gadget View
| Section |
|---|
| Column |
|---|
| Image Removed |
| Column |
|---|
|
|
%: Indicates the progress of time spent of the issue
Grid numbers: Indicated the hours spent by day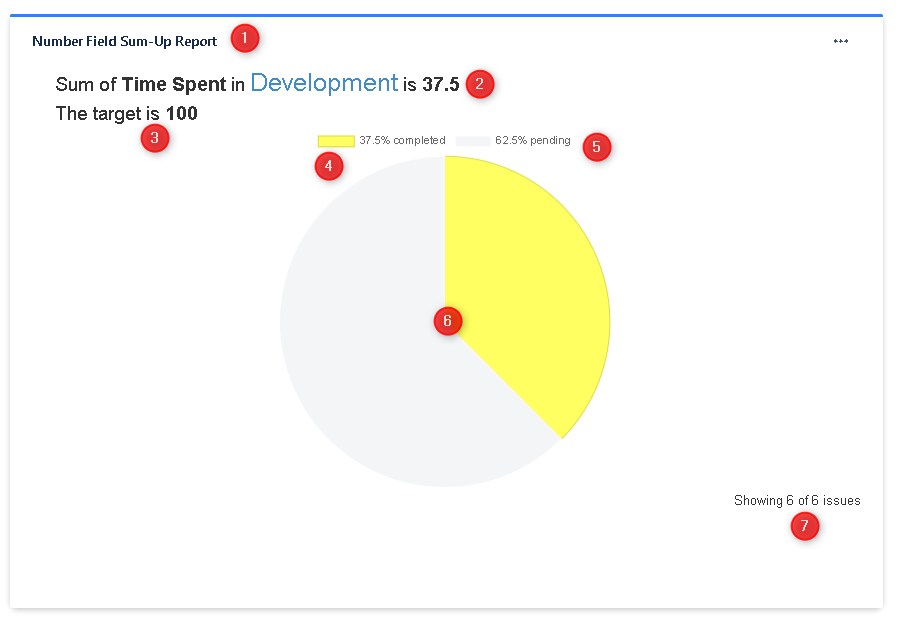 Image Added
1: This is the title of the gadget
2: The sum of the selected number field in the filter
3: The target
4: The completed percentage
5: The pending percentage
6: The chart with the field information
7: This is the information of the number of issues showed in the chart. If not all issues in filter are showed you can fetch more